
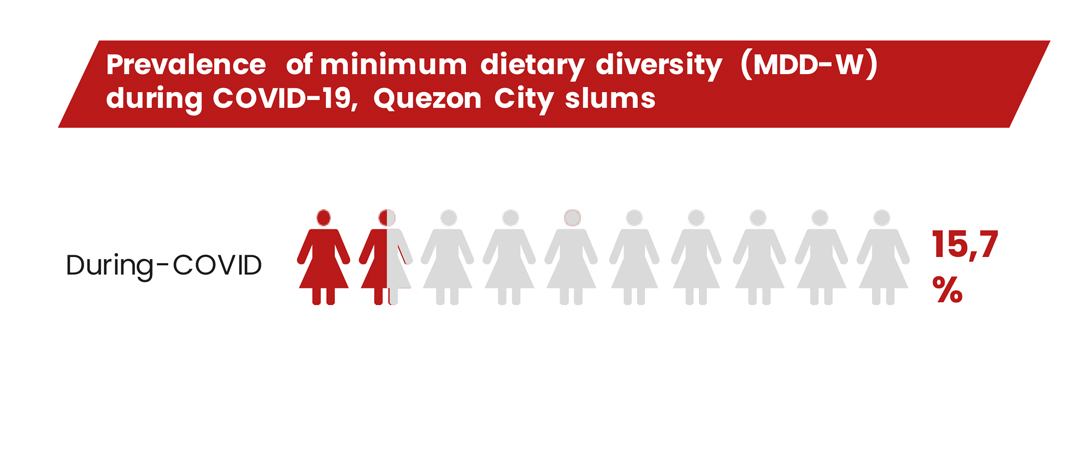
Before COVID-19, highmalnutrition rates inurban areas in the Asia region

Cities worst hit by COVID-19Insufficient evidence on how food systems have adapted

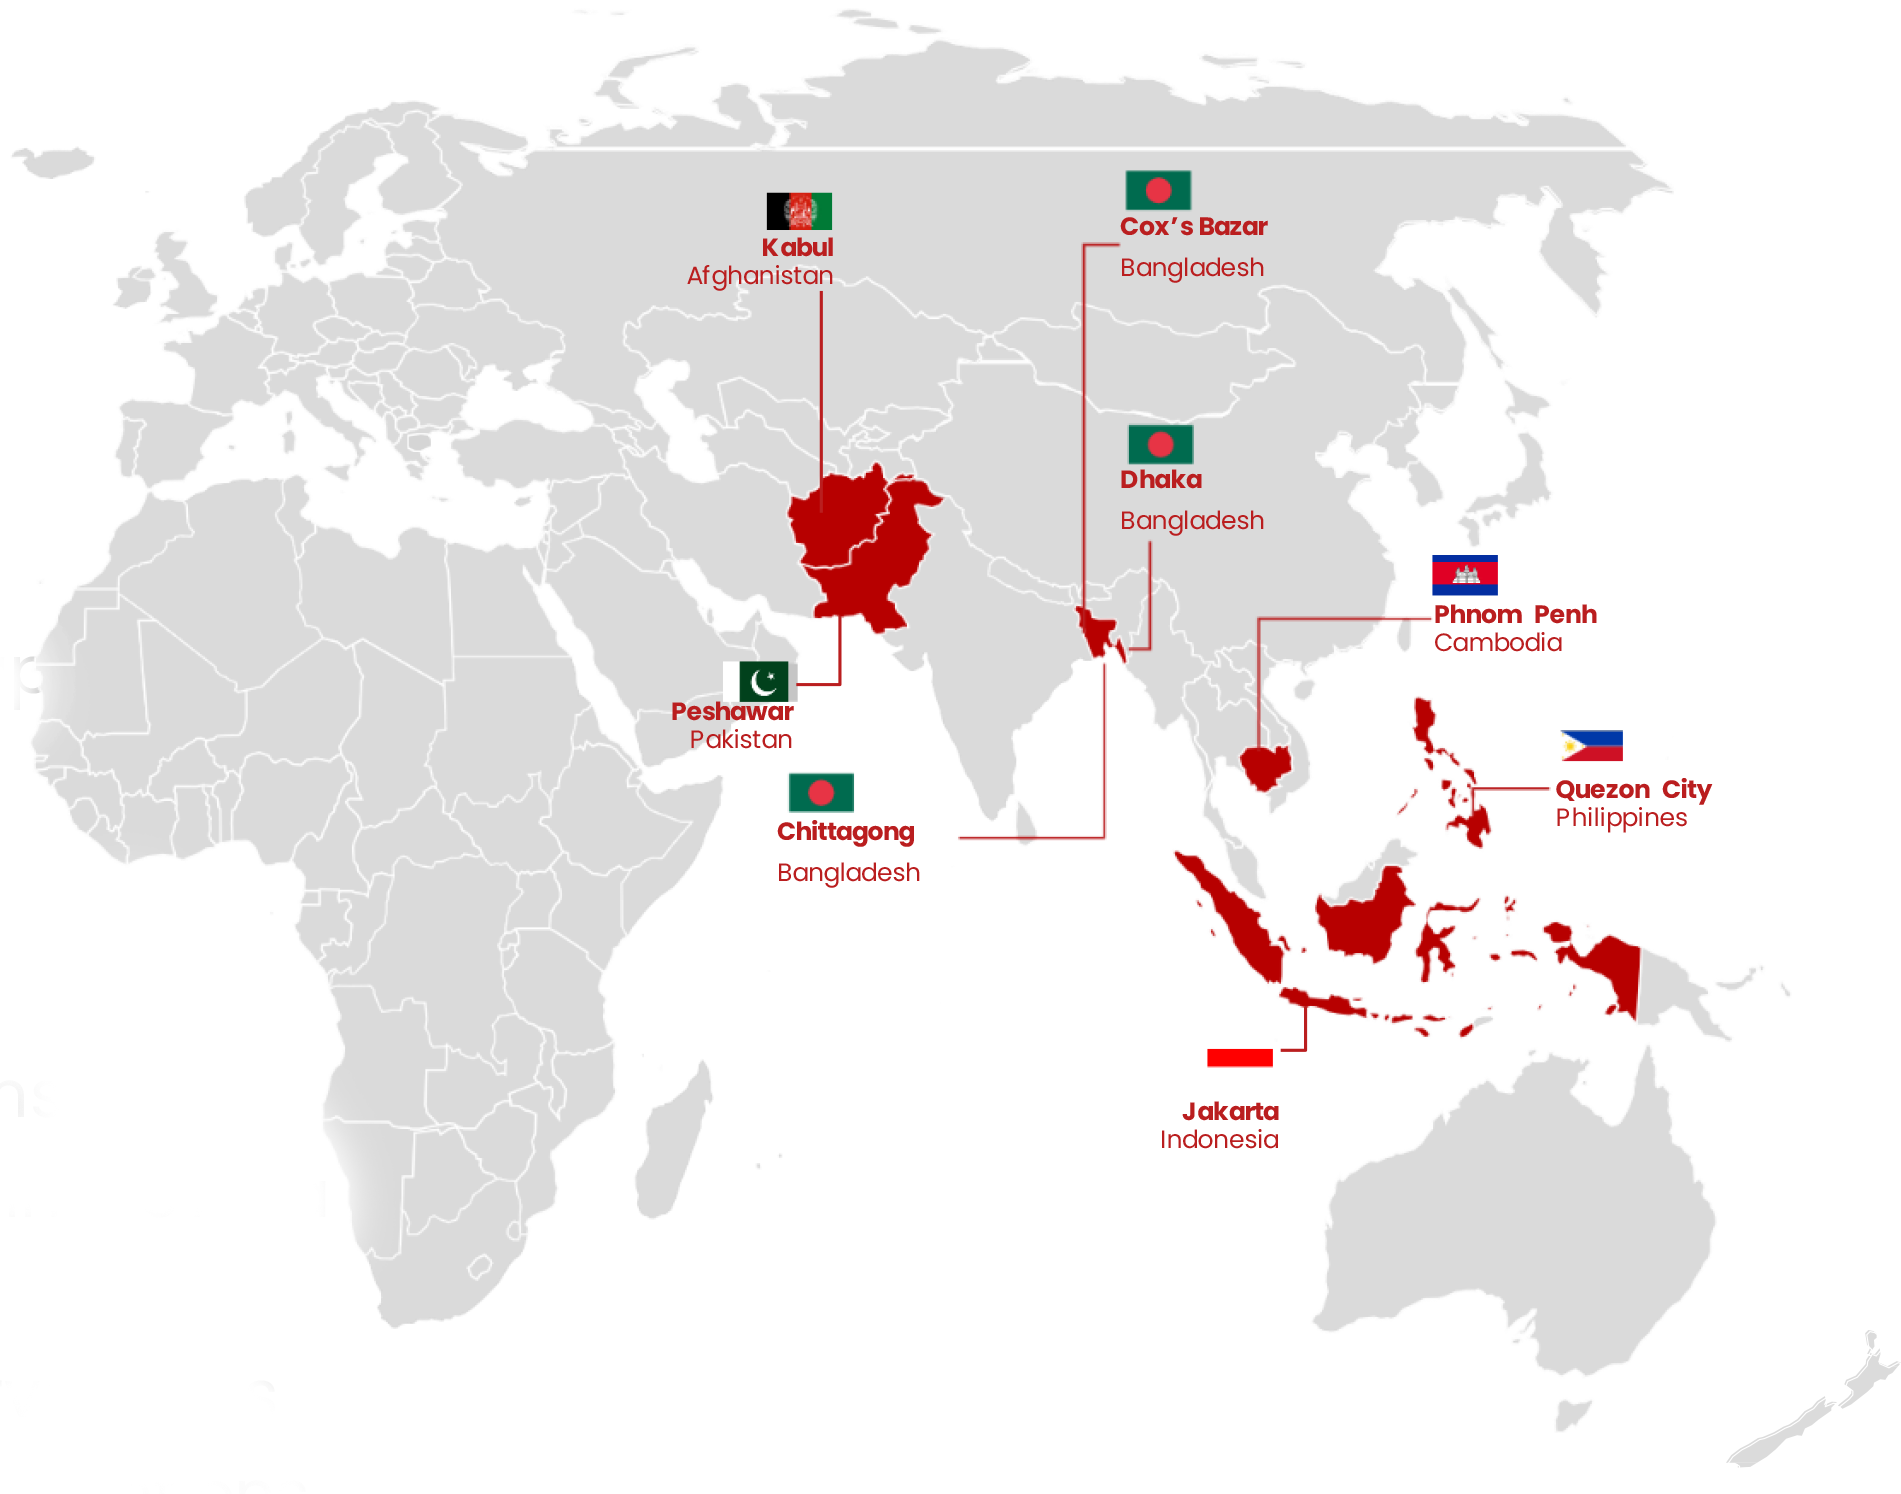
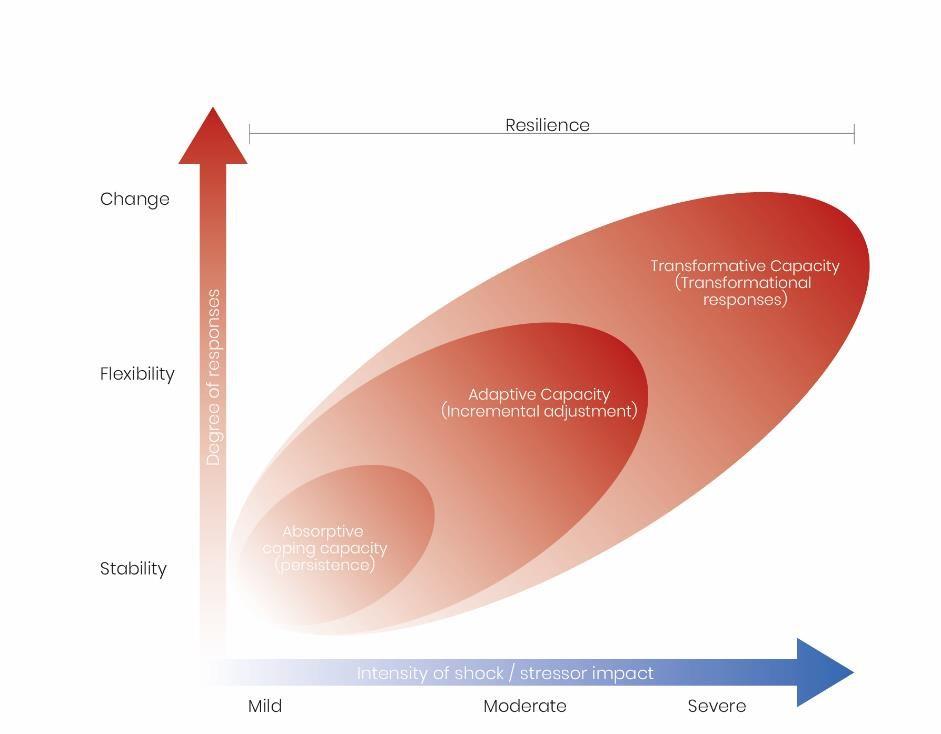
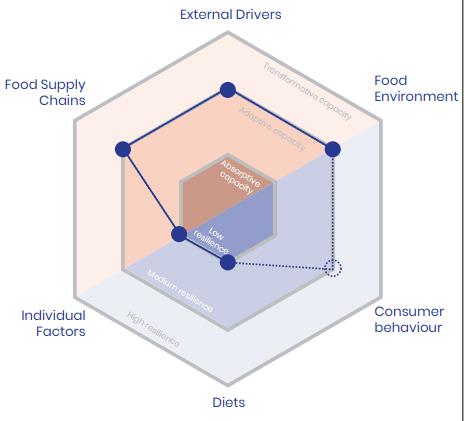
1.Assess the level of resilience of urban food systems in the face of the COVID-19 crisis in eight selected cities in the Asiaregion
2. Build evidence on nutrition-specific/sensitive interventions and provide an opportunity to evaluate urban interventions
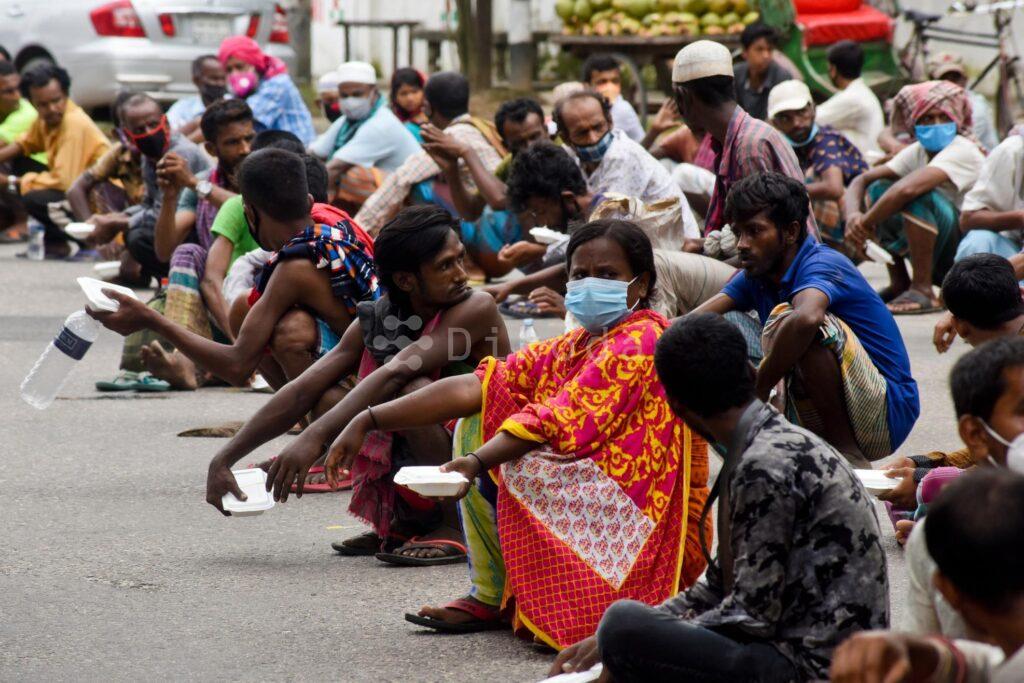
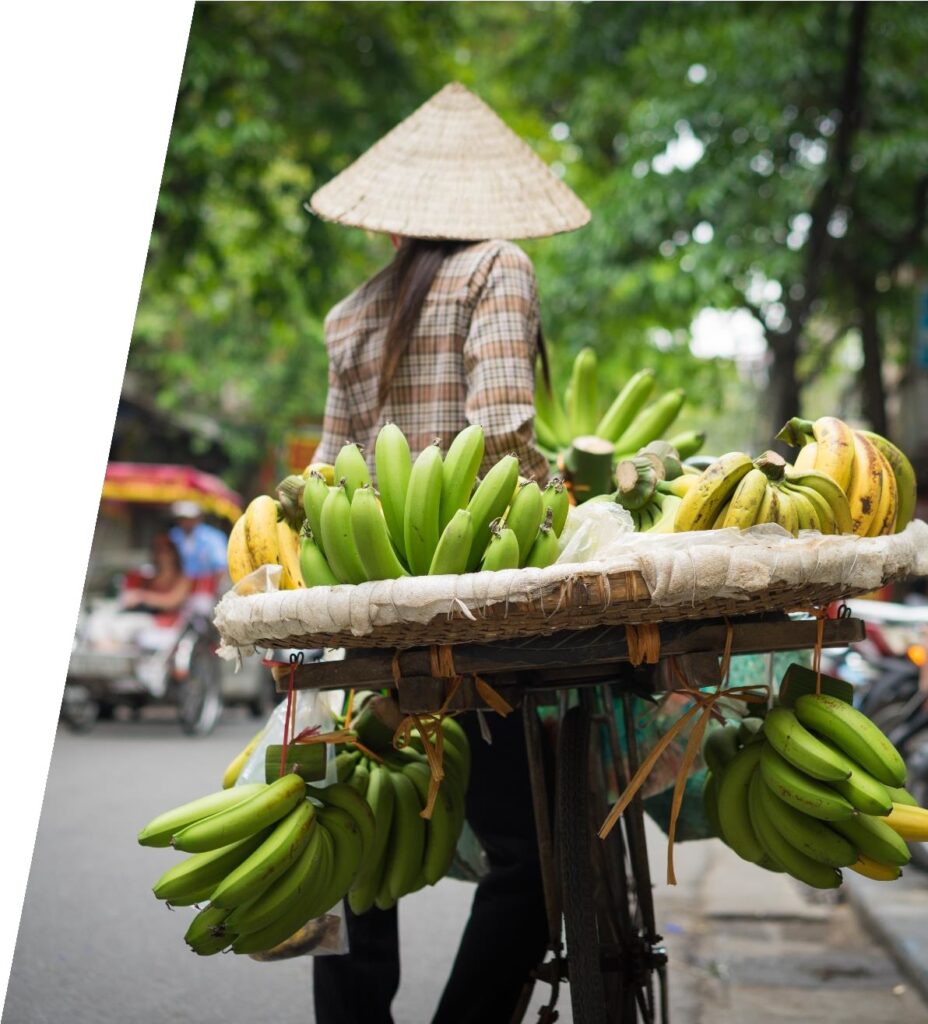
3. Understand the food environment in slum settings and the level of resilience of informal food actors during COVID-19

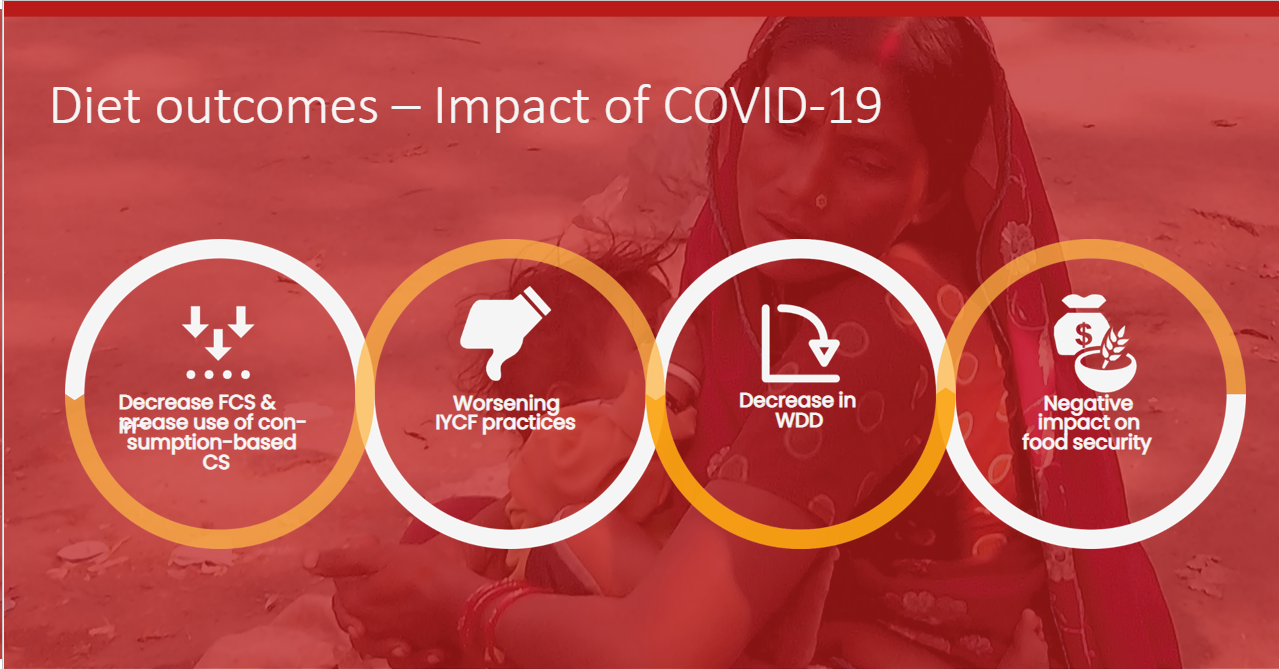
Disruptions to food supplychains

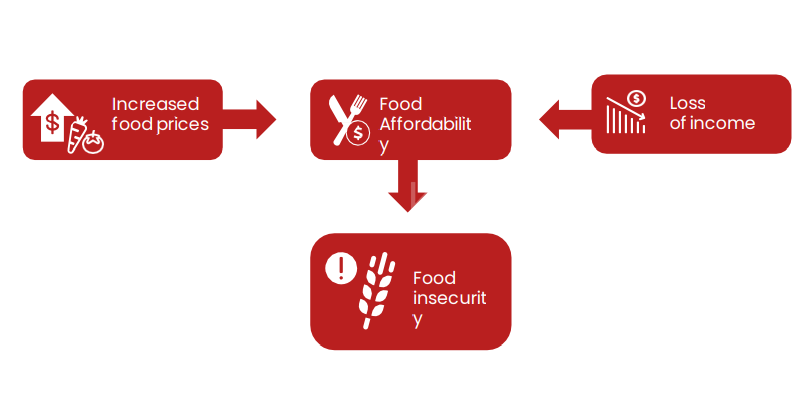
Increased foodprices

Lossof income

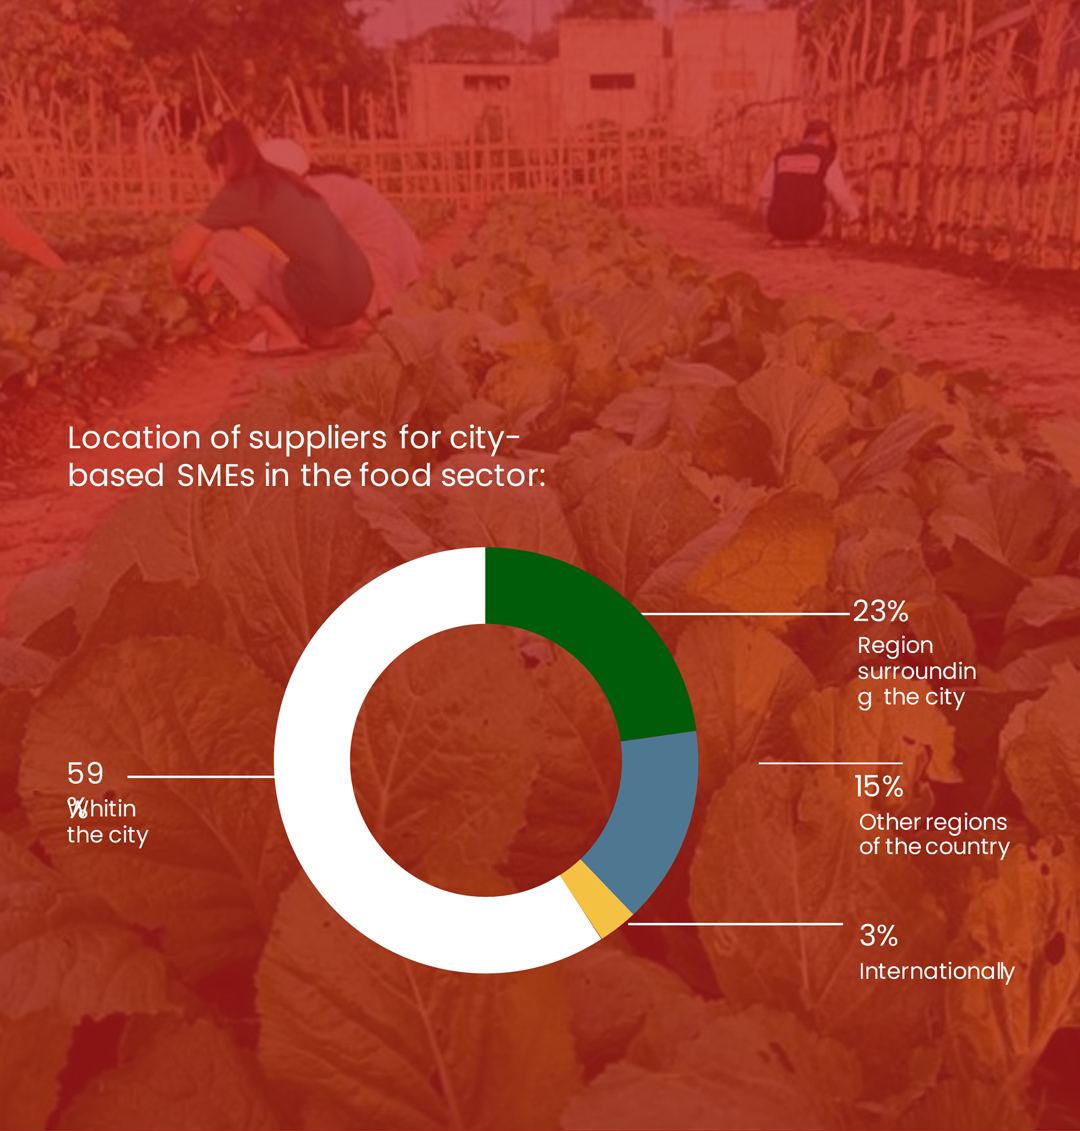
Food supply chains were disruptedby border closures and travel restrictions duringthe pandemic

Urban areas typically have longer and morecomplex supply chains than rural areas

Interventions and responses:
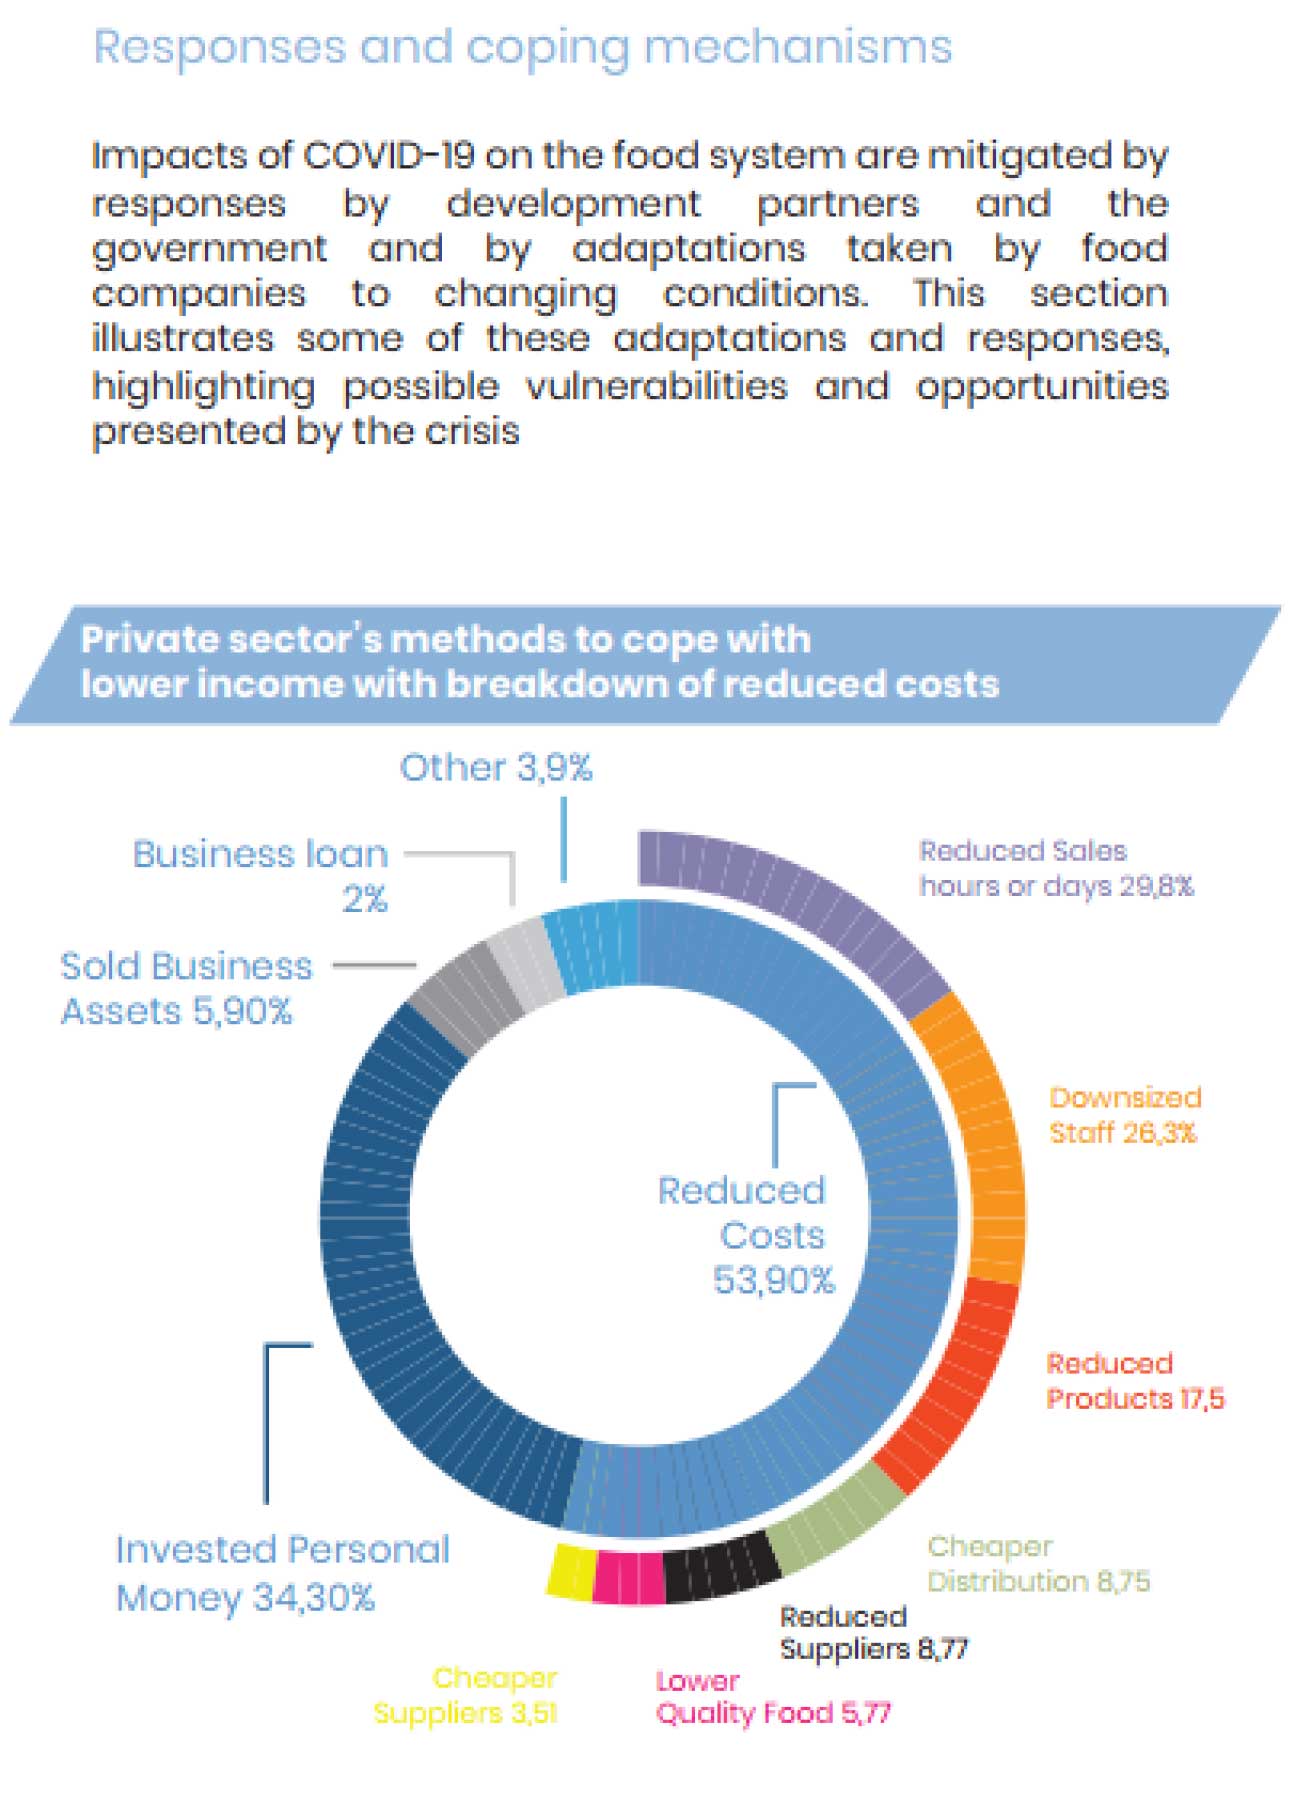
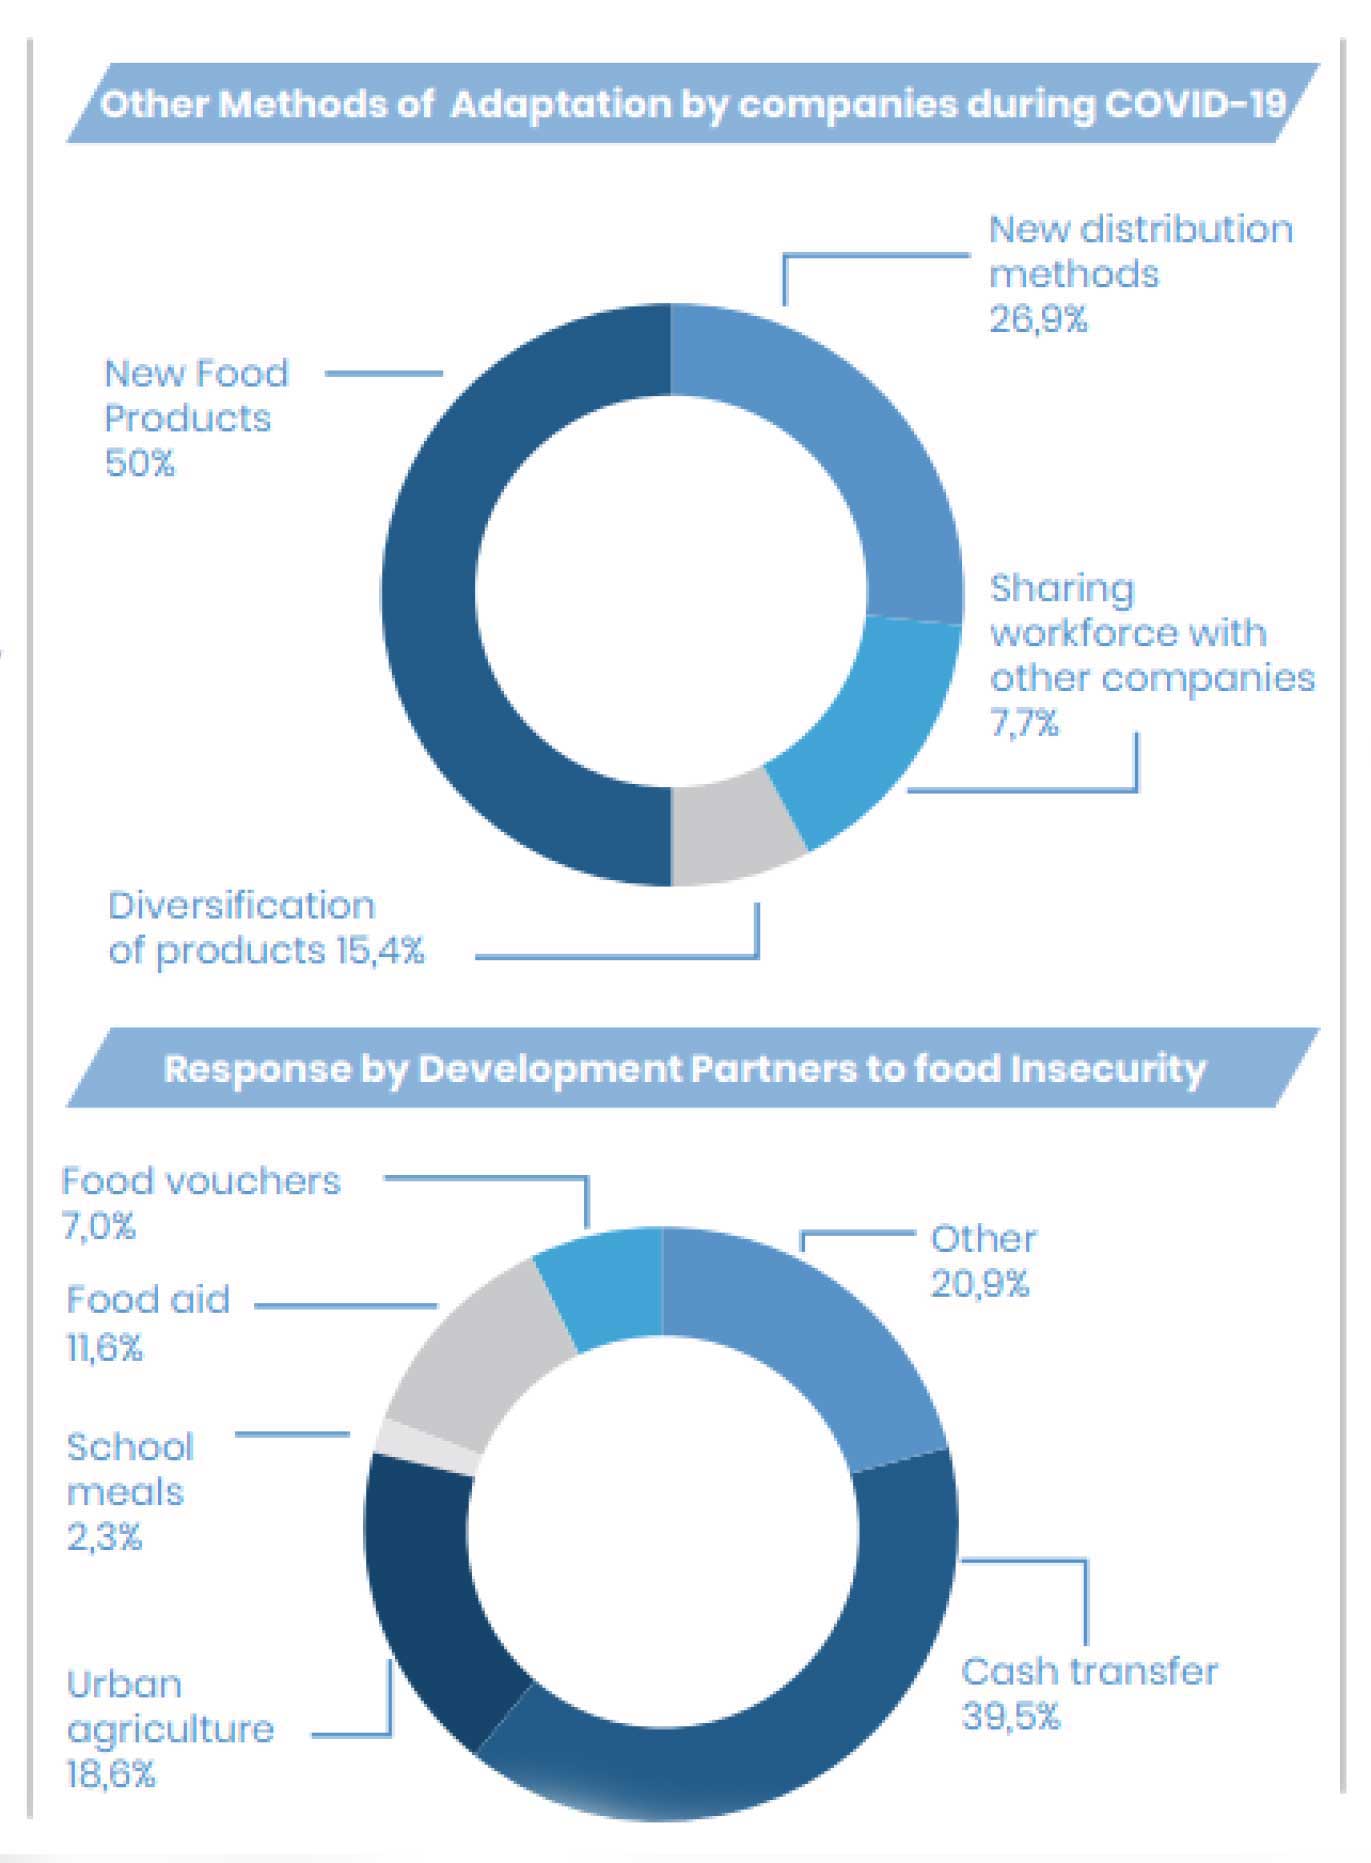
- Business adaptations
- Government measures to keep food moving
- e-commerce
- Urban agriculture
The combination of increased food prices and loss of income affected foodaffordability for the urban poor

Food prices increased in all eight cities with considerablevariationsbetween cities and between food groups
Daily wage earners have experiencedloss of income, indebtedness and foodinsecurity
Interventions and responses:
- Social protectionprogrammes
- Emergency cash assistance


Population and land-use dynamics influences the form of the city and the nature of the underlying food system

As cities grow, economic growth tends to attract more people, increasing the need for serviced land for settlement, reducing the space used to grow crops

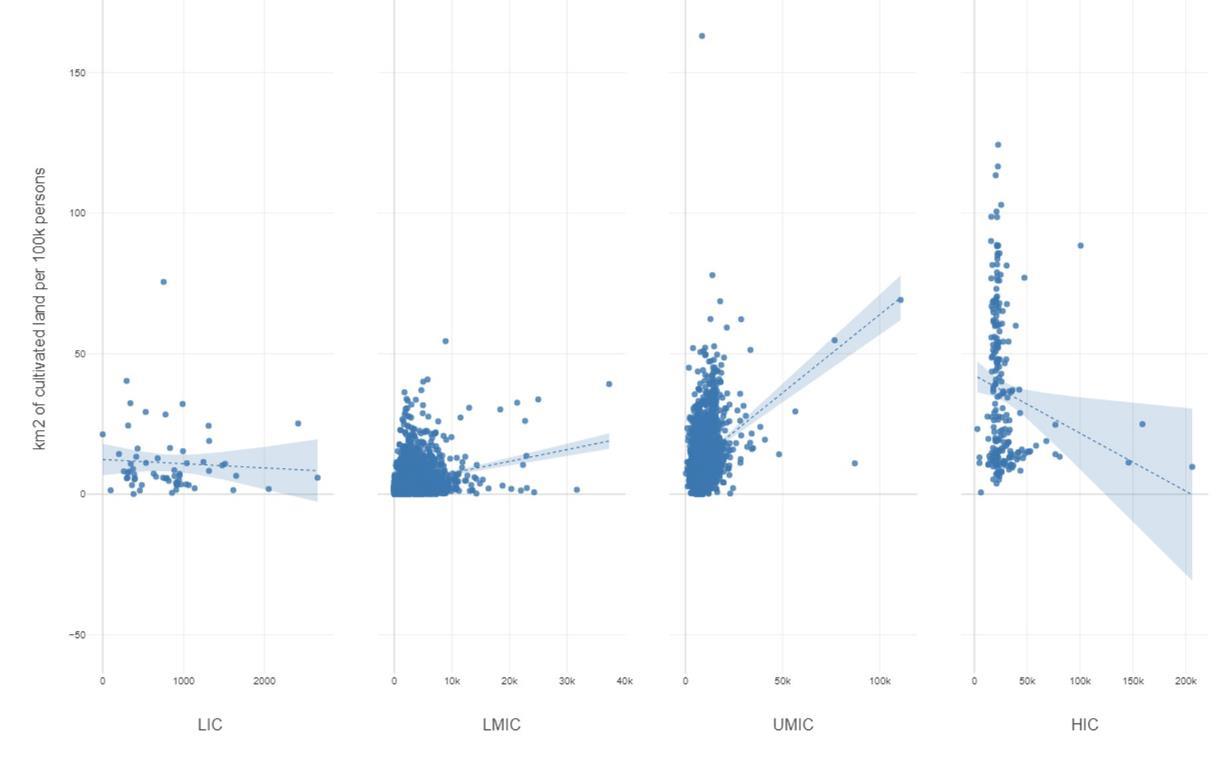
Use of global (peer-reviewed) datasets that givetime-series data to help analyse trends i.e. growthrates etc
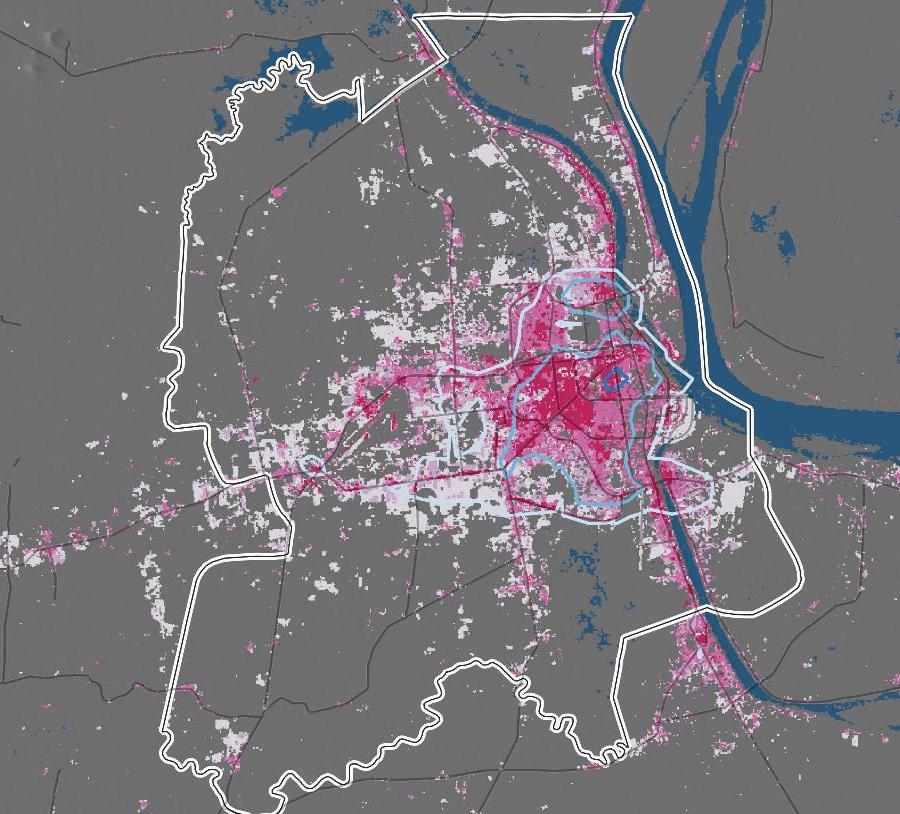
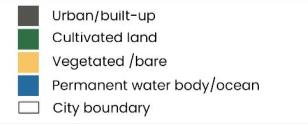
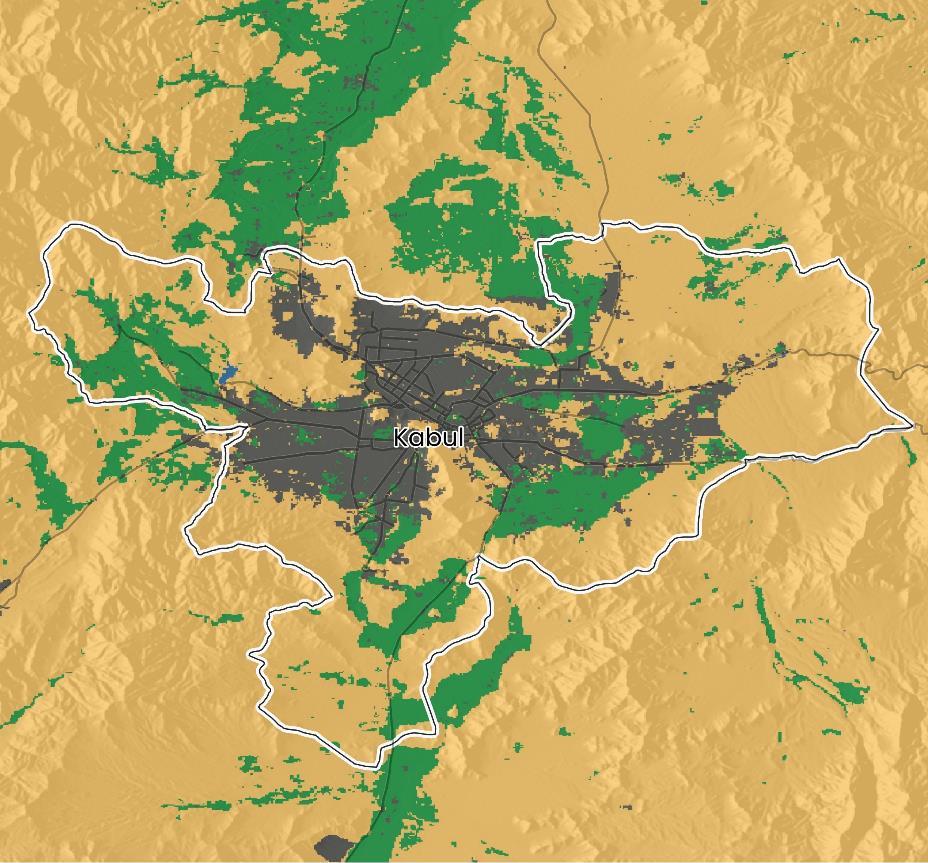
A city’s relationship with land changes
Diets change, greater consumption of ‘luxury foods’
Inequality may rise too, urbanization of poverty is a reality in many Asia-Pacific cities, growth of slum populations

Aim to provide snapshots of city-level foodsystems and COVID-19 related impacts andvulnerabilities.

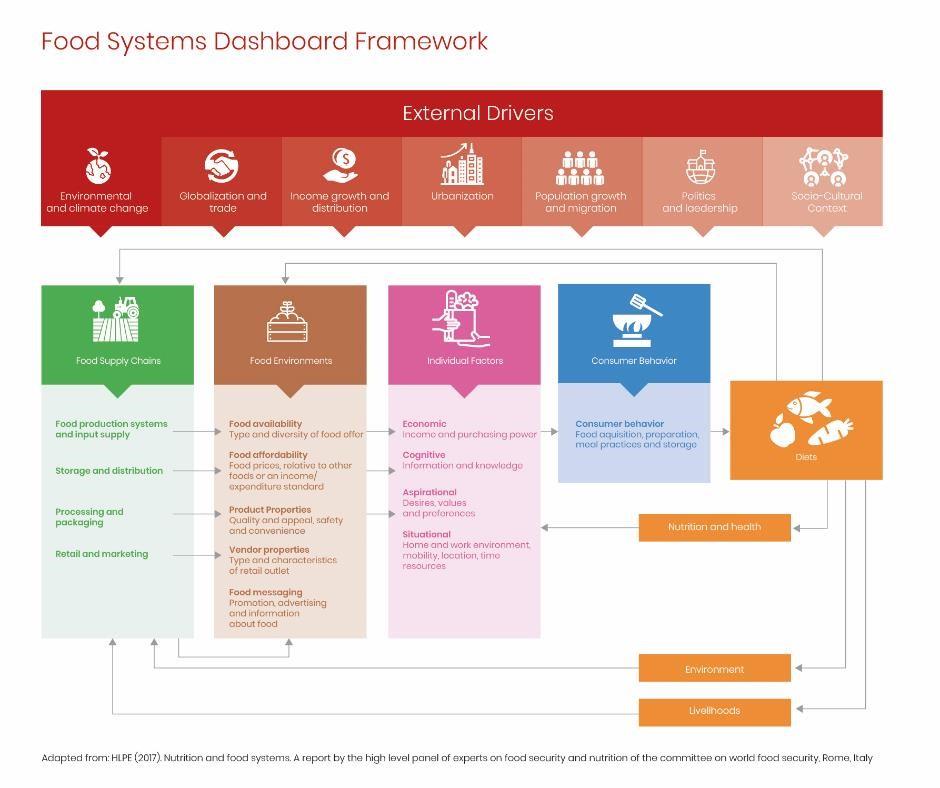
Based on the conceptual model of the Food Systems Framework with focus on available dataand components that are likely to be impacted by COVID-19.

Data from primary and secondary sources.

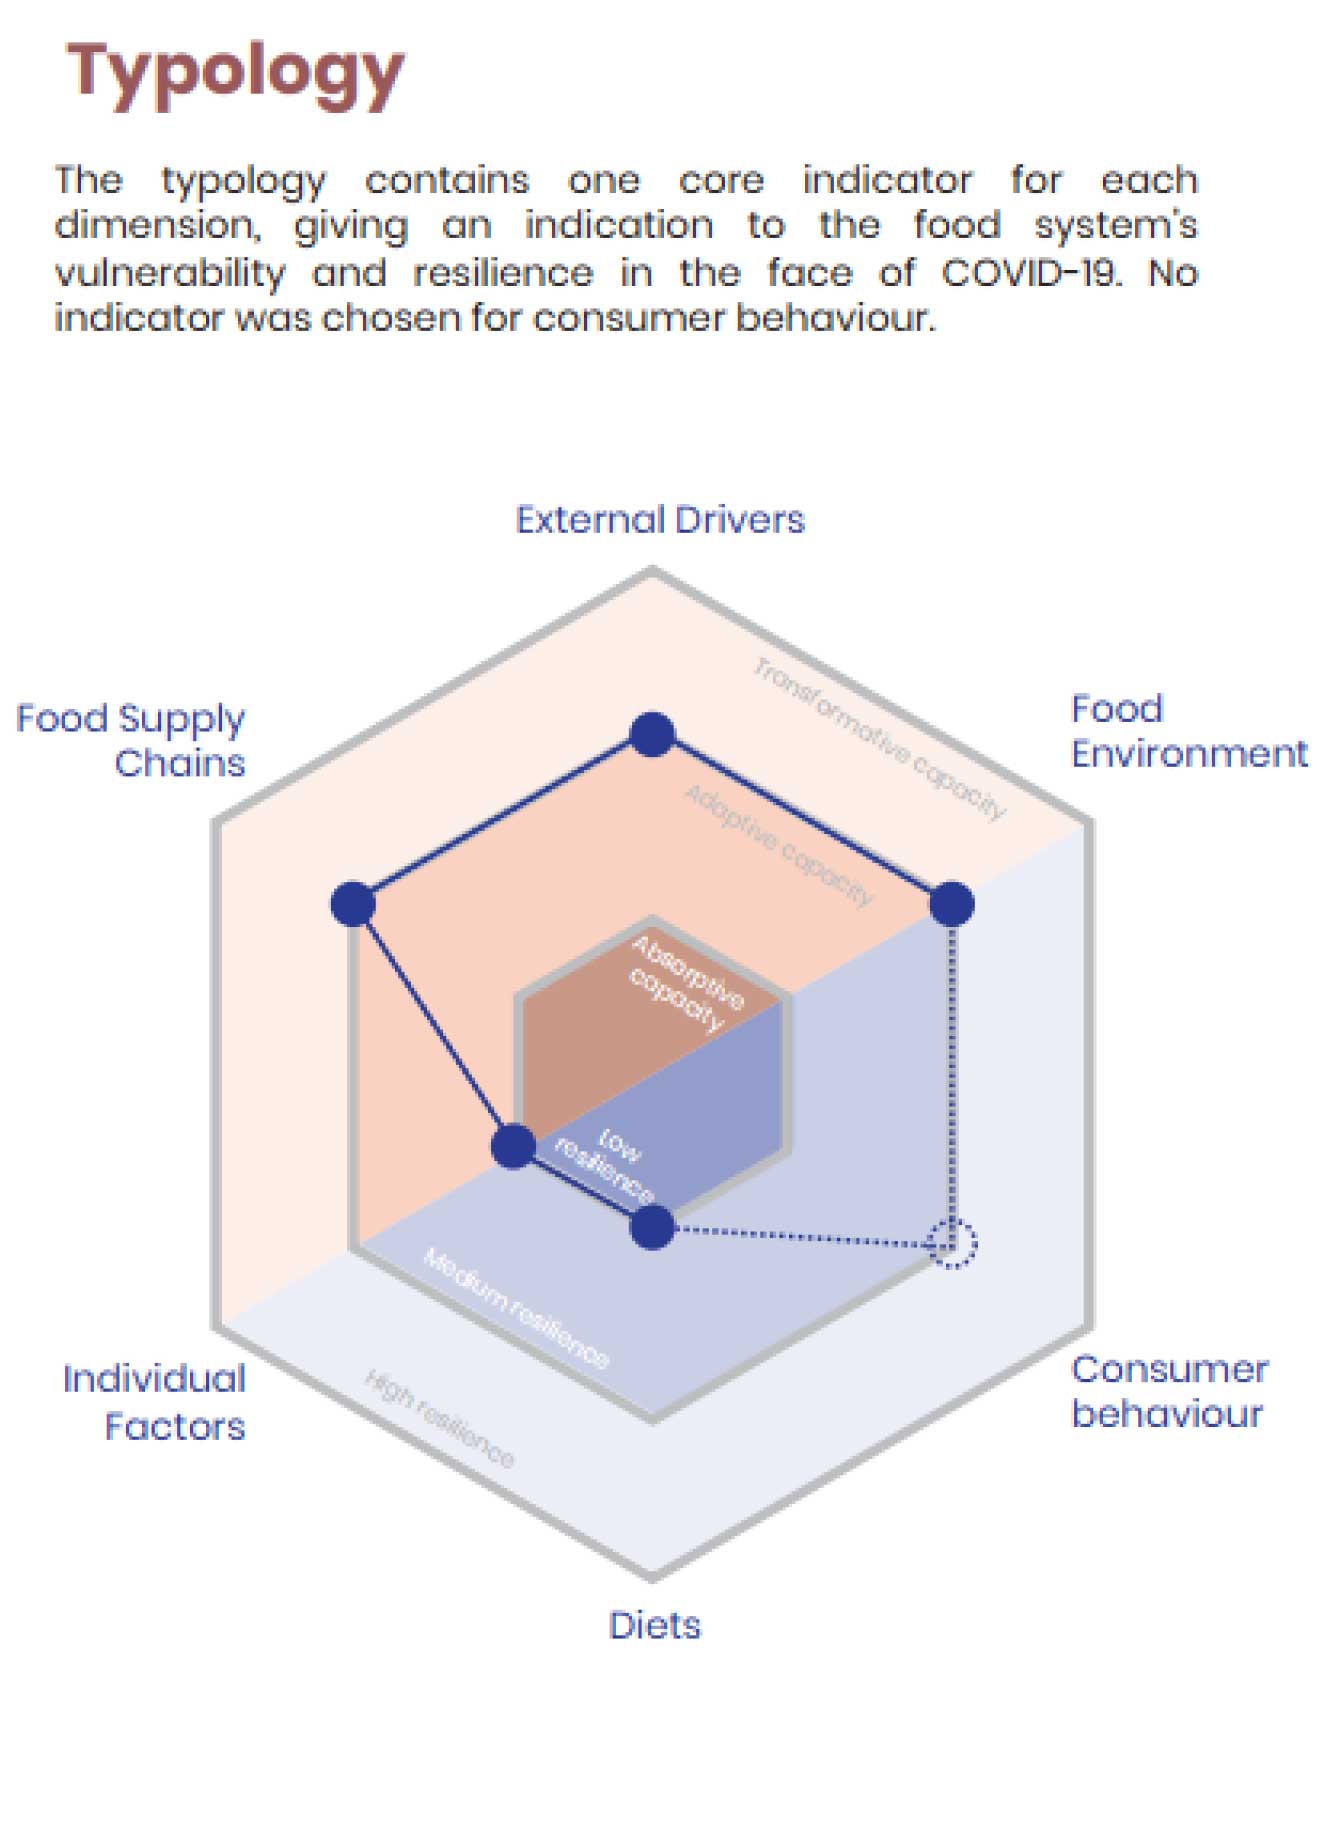
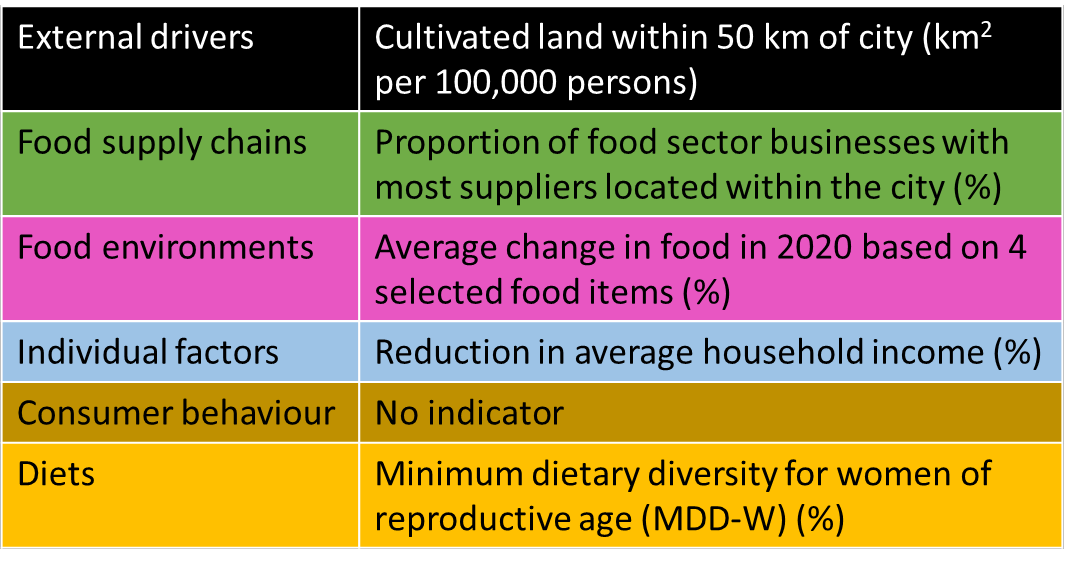
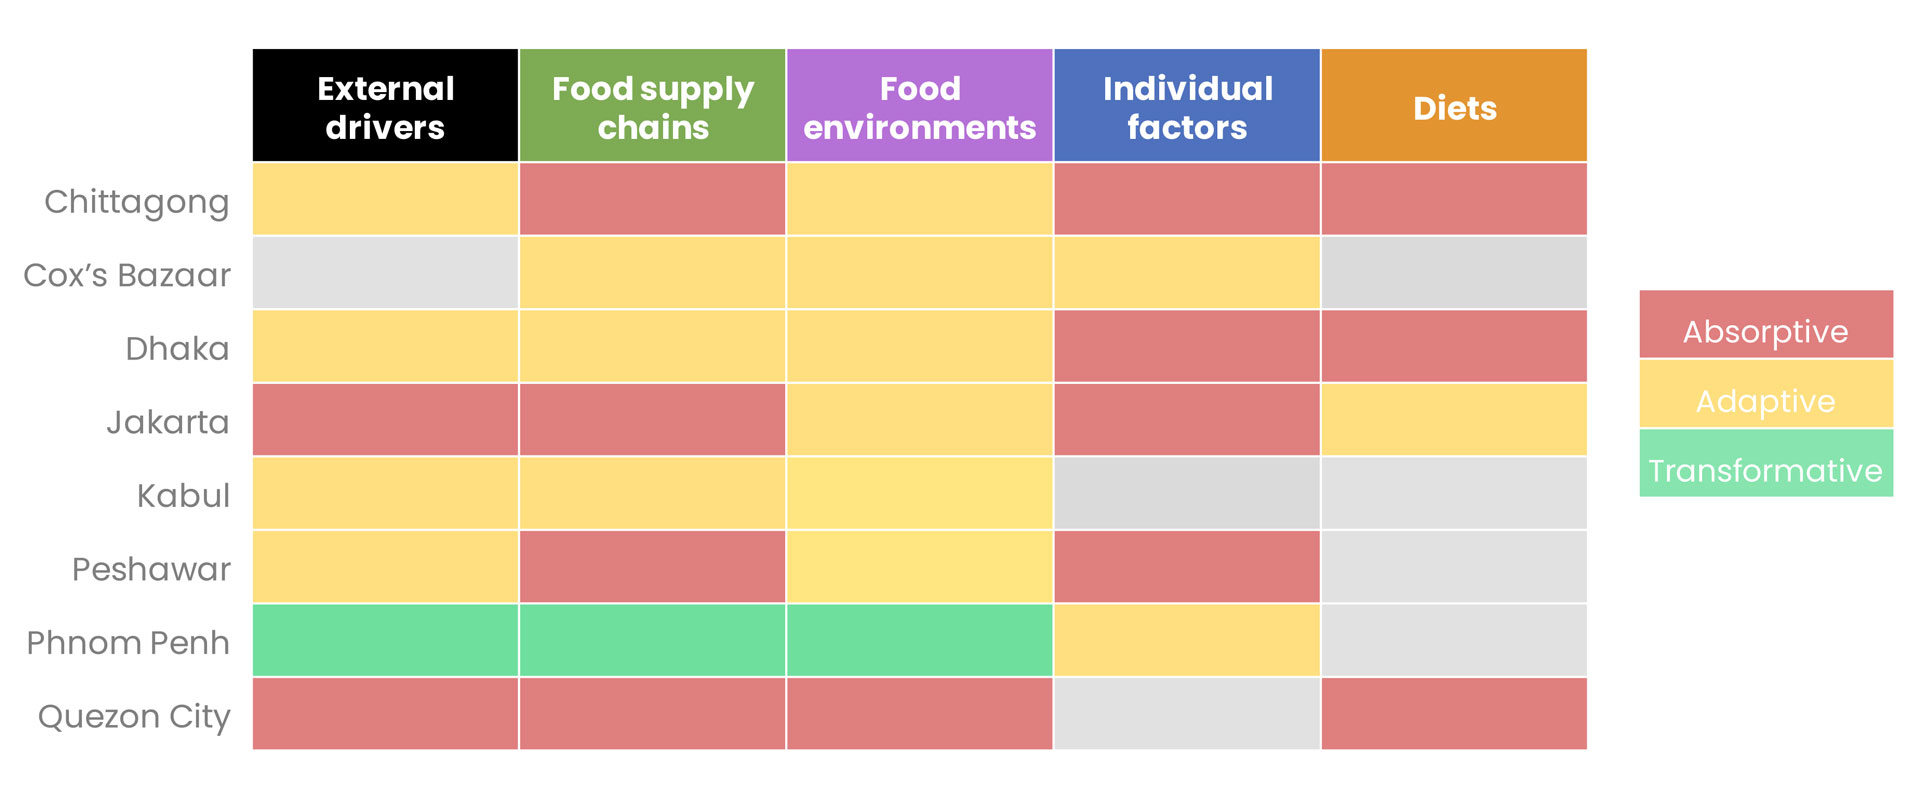

Standardized indicators of resilience and vulnerability to facilitate comparisons between cities

Formalization of urban food system typologies

Use of innovative approaches to defining urban areas

Private sector partnership – combine technical assistance and knowledge transfer

Social protection and safety net programs –adaptative and responsive to shocks